It arrives on a Tuesday. You open your Anthropic dashboard, see a number that's 40% higher than last month, and spend the next two hours trying to figure out why. You check the usage graph. It went up. That's all it tells you.
This is the default experience for every team shipping LLM features in production. The providers give you a total. They give you a graph. They do not tell you which feature caused it, which user triggered it, or whether it happened gradually or in a single spike after last Wednesday's deploy.
This post covers how to get that visibility — what to instrument, what the data looks like once you have it, and why it matters more than it might seem.
What the provider dashboard actually shows you
Anthropic's usage dashboard gives you total tokens and total cost, broken down by day and by API key. OpenAI's is similar — spend over time, a model breakdown, usage by key. Both are useful for one thing: confirming that your bill is real.
What they don't show:
- Which feature in your product is driving the spend
- Which users are the highest consumers
- How cost per call changed after a specific deploy
- How many calls returned nothing — errors, empty outputs, retried requests
- Whether the spike happened gradually or in a single hour
This isn't a criticism of the providers — cost attribution at the feature level isn't their job. It's yours. But without it, "your LLM bill" is genuinely opaque in the same way your AWS bill is opaque before you tag your resources.
The three questions you actually need answered
When a bill goes up, there are only a few possible causes. Narrowing to the right one quickly is what turns a two-hour investigation into a five-minute one.
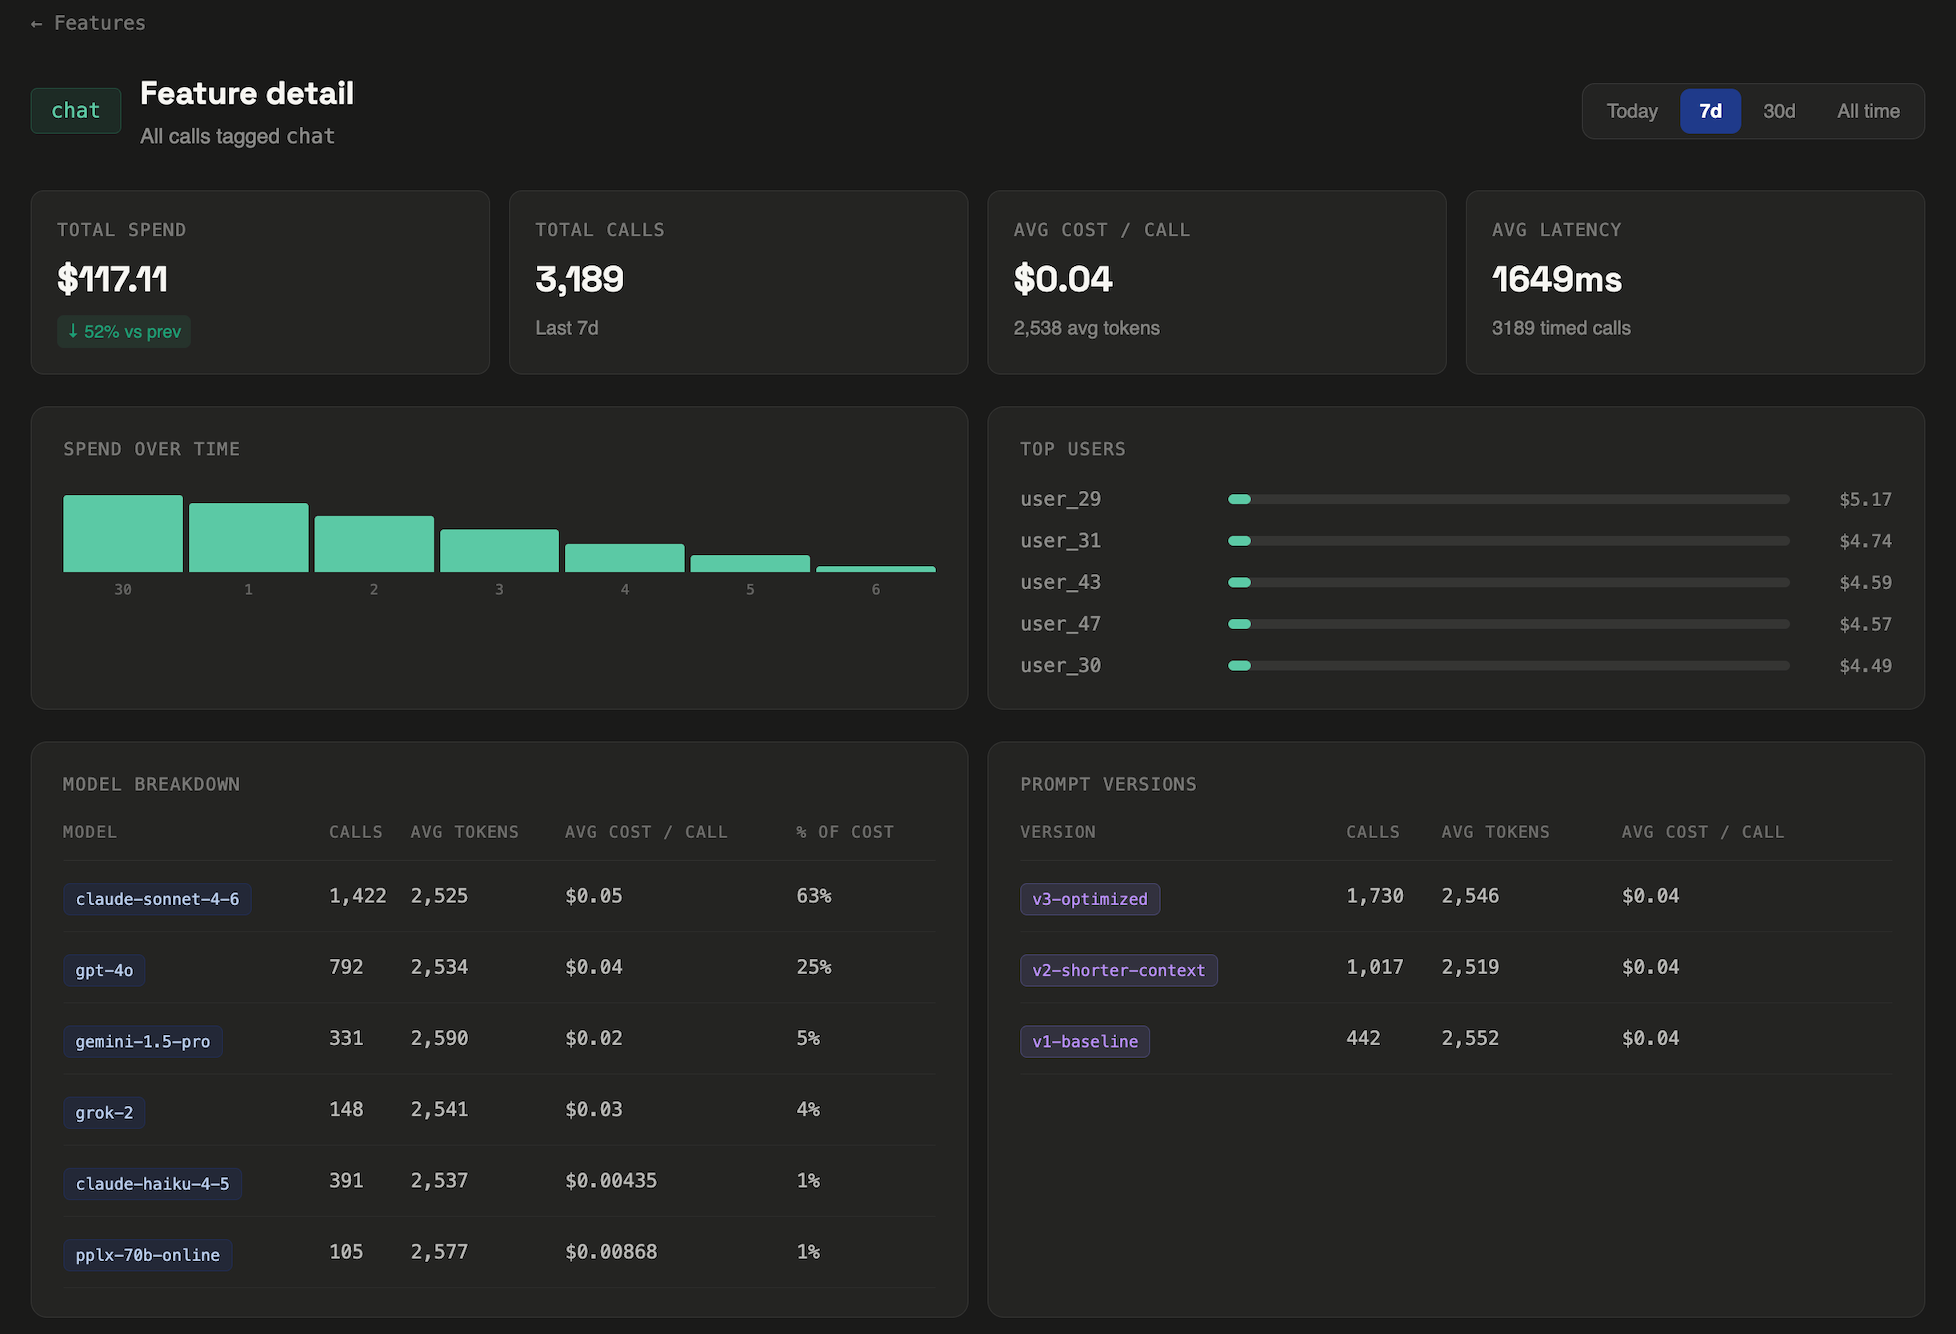
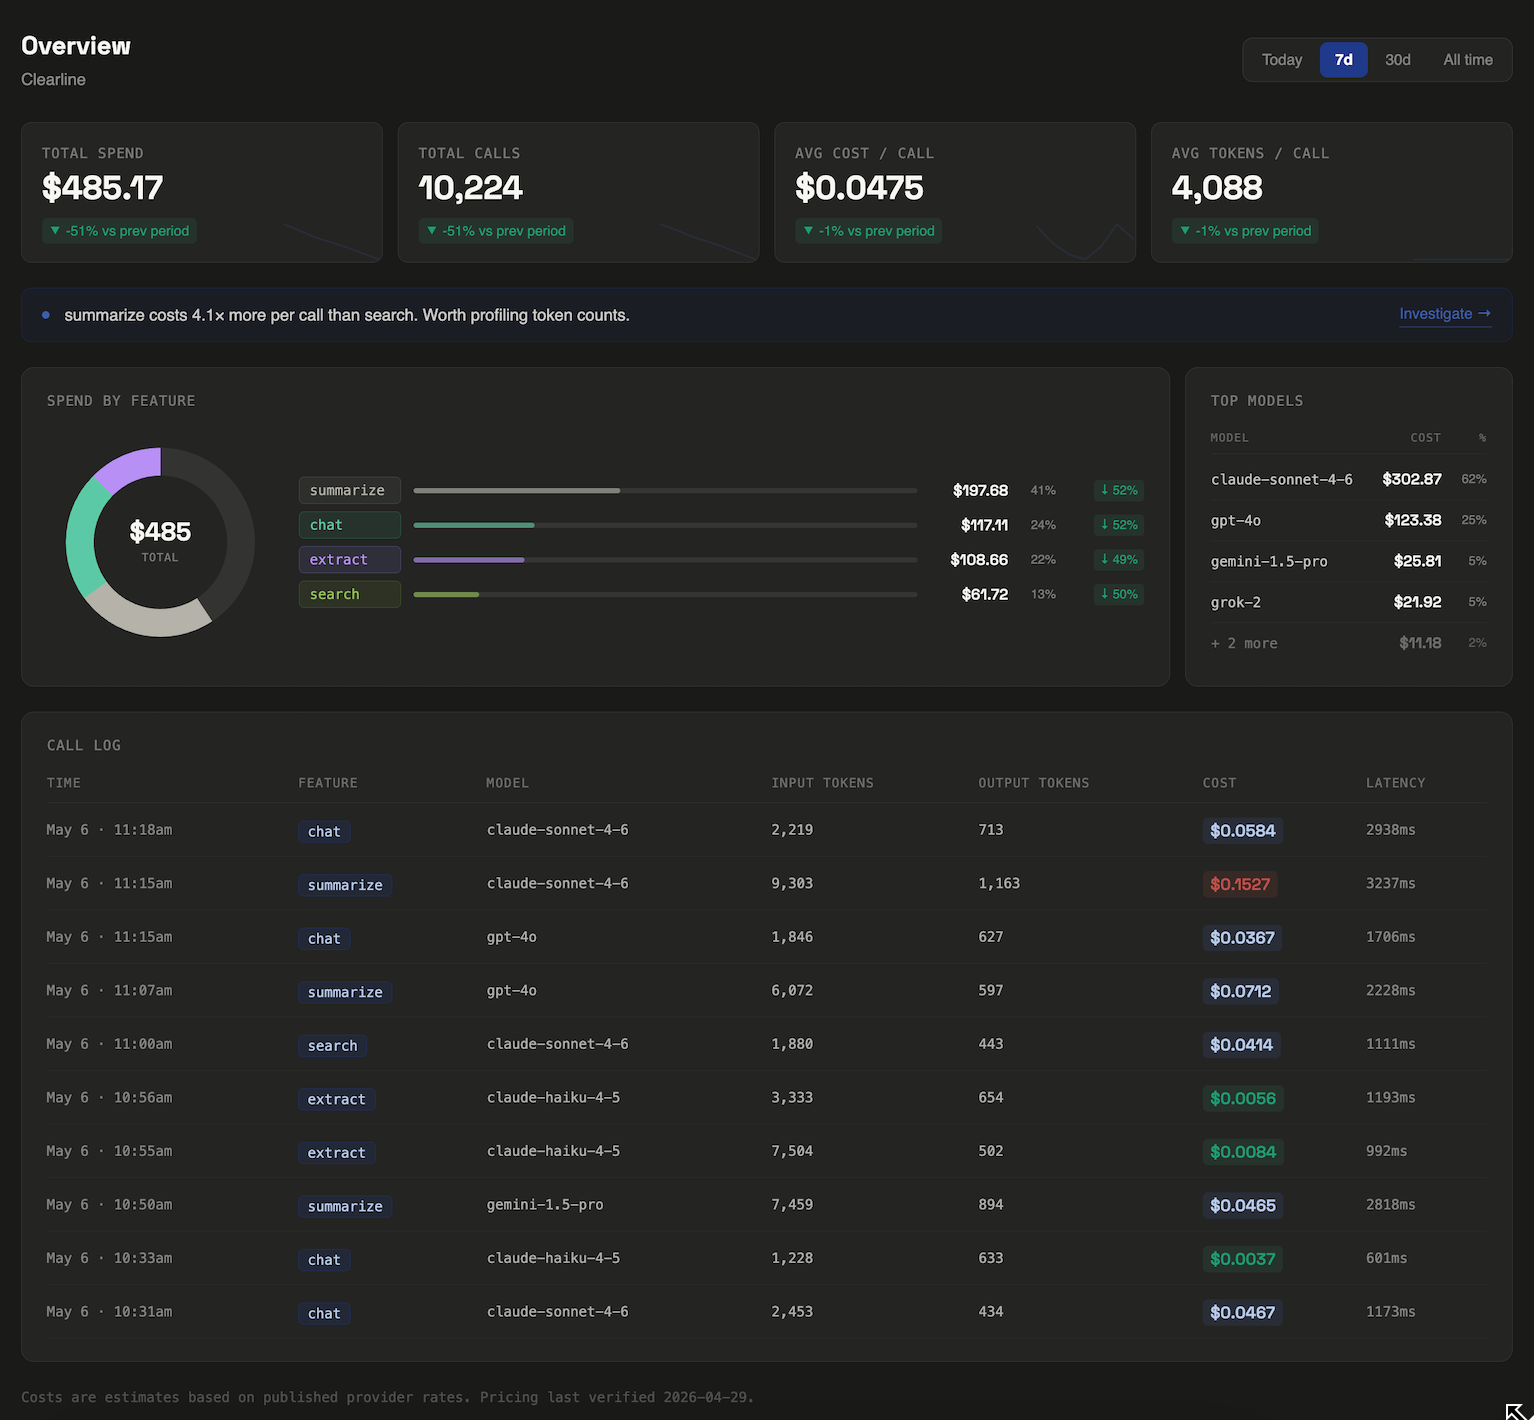
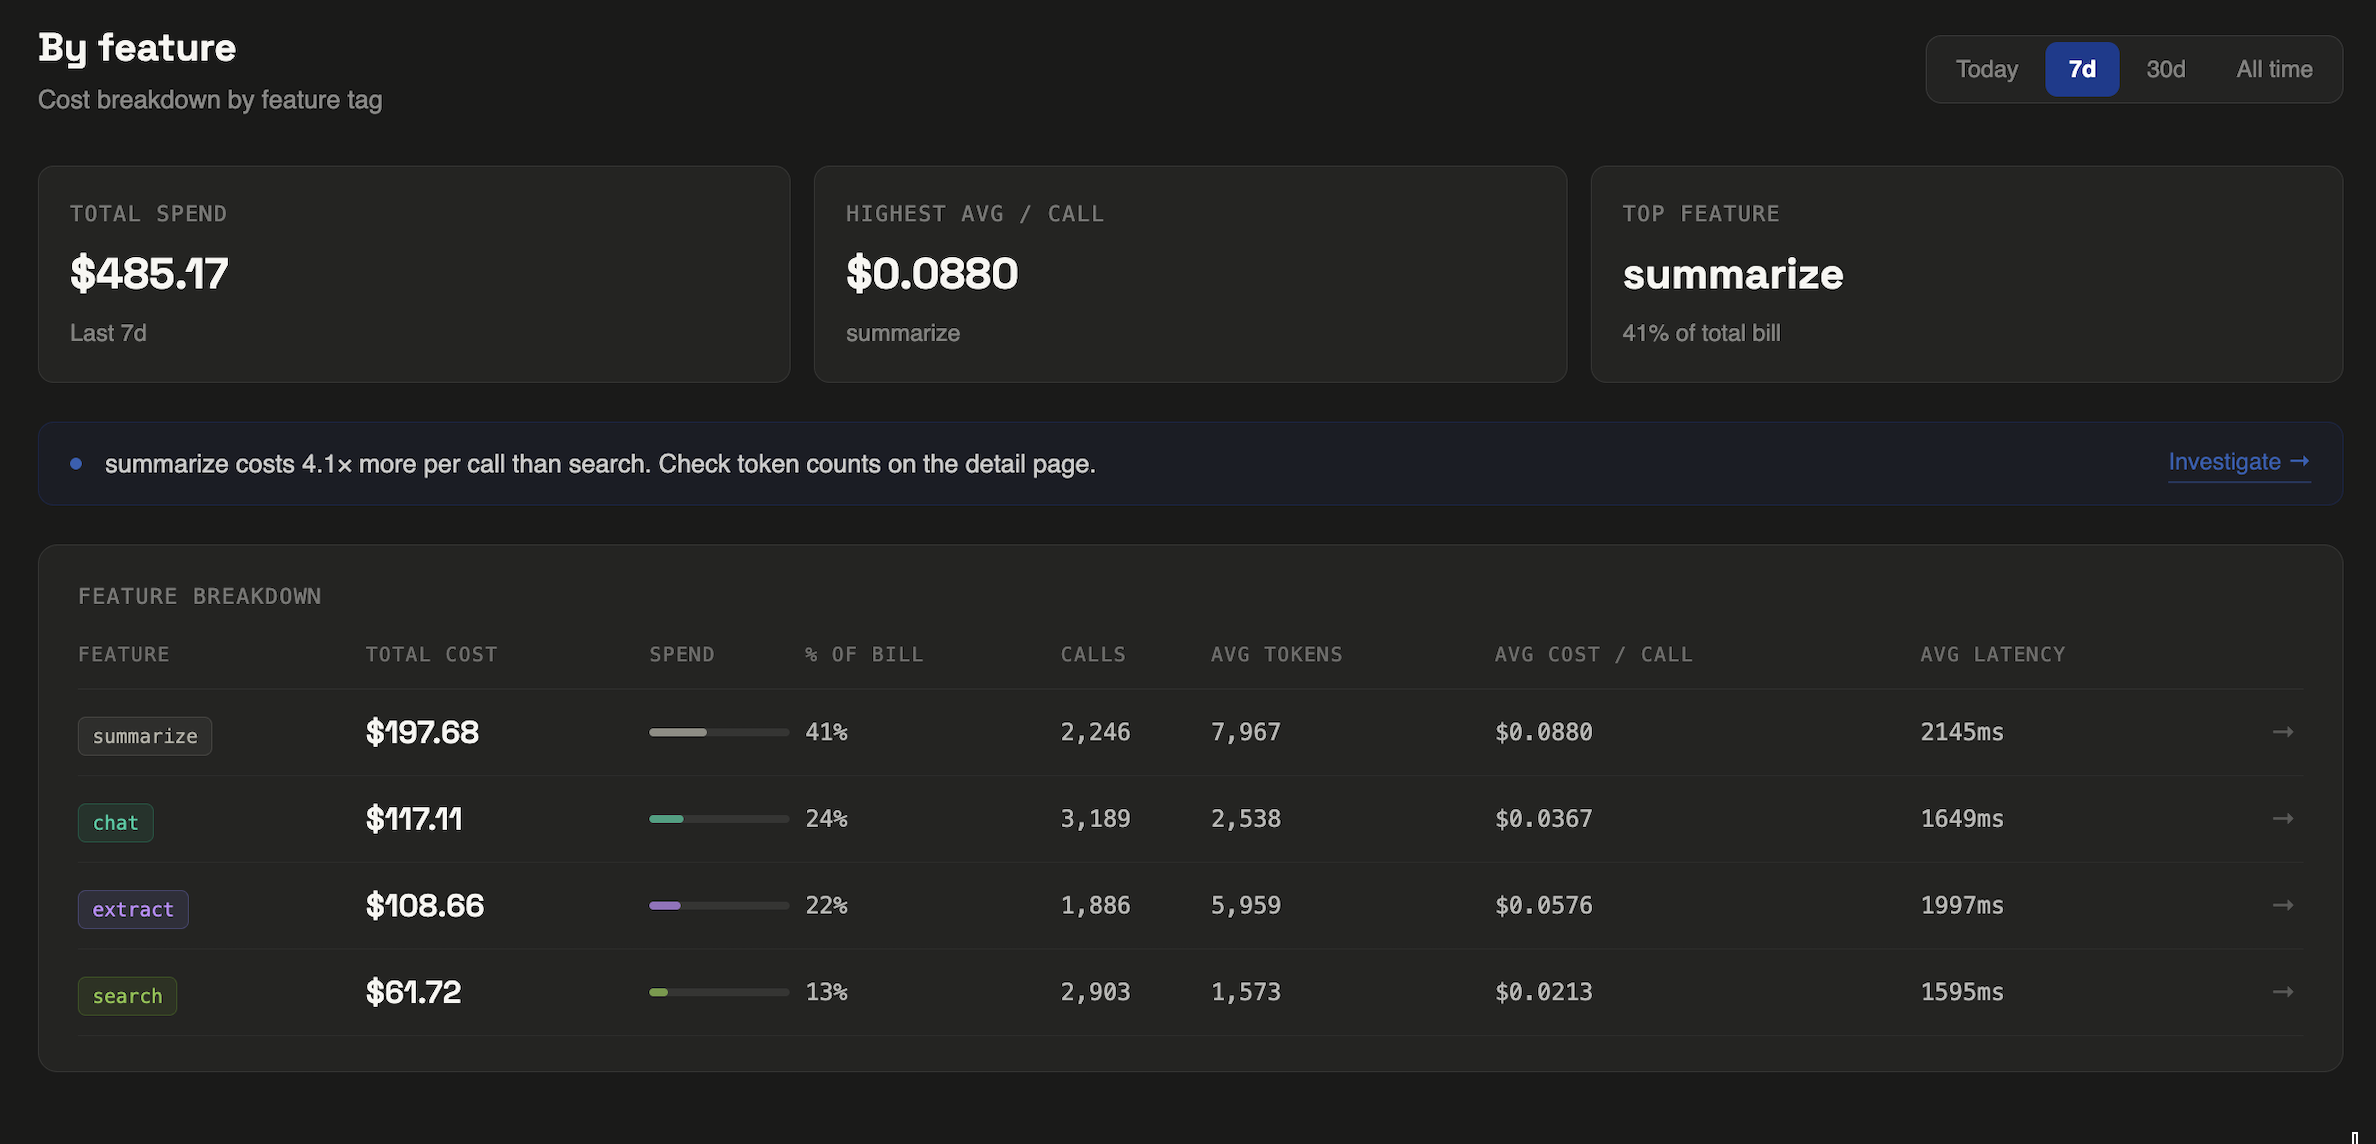
1. Which feature? Most products have multiple LLM-powered surfaces — a search feature, a summarization feature, a chat interface, an autocomplete, a background job. These have wildly different token profiles. A search that includes retrieved document context in every call might cost 10× more per call than a simple completion. You need to know which surface moved.
2. Which users? Usage is rarely uniform. In most production workloads, 5–10% of users drive 30–50% of LLM spend. They're power users, automated scripts, or sometimes just one person who found an expensive edge case and triggered it 800 times. Without per-user attribution, you can't find them.
3. When exactly? "This month vs last month" is usually too coarse. If cost per call jumped on a specific date, that date almost certainly corresponds to a deploy, a prompt change, or a new feature going live. Day-level granularity turns a mystery into a git blame.
How to instrument your calls
The core idea is simple: tag each LLM call with metadata at the call site, then aggregate that metadata server-side. You need three fields to answer the three questions above.
featureWhich product surface made this call — e.g. 'search', 'summarize'userIdYour app's identifier for the user — UUID, not emailpromptVersionOptional — a label for the prompt template in use at call timeWith LLM Cost Tracker, this is a single config object added to your existing call:
const result = await anthropic.messages.create({
  model: 'claude-sonnet-4-6',
  max_tokens: 1024,
  messages,
})const result = await trackedCall({
client: anthropic,
params: { model: 'claude-sonnet-4-6', max_tokens: 1024, messages },
apiKey: process.env.LCT_API_KEY,
feature: 'search',
userId: session.userId,
})The SDK reads token counts and cost from the response object after the call resolves, then posts the event asynchronously. Your call path is unchanged — no proxy, no added latency, no new failure mode.
OpenAI calls work identically — swap in your OpenAI client, same interface. Google Gemini and xAI are supported the same way.
What you find when you turn it on
The first thing most teams notice is a cost variance they didn't know existed. Features that feel similar from a product perspective often have completely different token profiles.
Here's a real example from a contract analysis tool where LLM Cost Tracker was first built and tested. Two search features, similar on the surface, with a 5× cost difference per call:
Neither search was broken. Both returned good results. But without per-feature tracking, the full-doc search was invisibly expensive — and at scale, that difference matters. At 10,000 calls per month, clause search costs $123. Full-doc search costs $608.
The fix wasn't switching models. It was chunking the input differently for full-doc search to reduce context size per call. That single change brought the cost within 20% of clause search. Total time to identify and fix: about two hours, once the data was visible.
Anthropic vs OpenAI: does the provider matter?
For cost tracking purposes, the provider is almost irrelevant — the instrumentation pattern is the same. What matters is that you're tagging at the call site, not at the provider level.
That said, there are a few provider-specific things worth knowing:
Anthropic prompt caching can dramatically reduce input costs for features with long, stable system prompts. If you're passing a 2,000-token system prompt on every call, cache reads cost ~10% of the normal input rate. For a search feature running 50,000 times a month, that's potentially $270/month saved on Sonnet alone. You won't know it's worth pursuing until you can see which features have the largest input token footprint.
OpenAI has more model tiers to mix and match. The gap between gpt-4o and gpt-4.1-nano is enormous — roughly 25× on input tokens. Teams that instrument by feature often discover that several of their features were over-specified: running on a flagship model when a cheaper one would have been fine. You can only run that experiment if you know what each feature actually costs.
Multi-provider stacks are increasingly common. A team might use Anthropic for reasoning-heavy tasks and Gemini Flash for high-volume cheap calls. Without a unified tracking layer, you're back to reconciling two separate dashboards with no cross-provider view.
What to do this week
If you're shipping LLM features and haven't instrumented your calls yet, the quickest path to visibility:
- Install the SDK.
npm install @llmcosttracker/sdk— takes about 30 seconds. - Wrap your highest-volume call first. Don't try to instrument everything at once. Pick the feature you're most uncertain about and tag it with
featureanduserId. - Let it run for 48 hours. You don't need a month of data to spot patterns. Two days of production traffic is usually enough to see cost variance across features.
- Then ask: what's the most expensive call? Sort by cost per call, not total spend. The most expensive call is usually the most fixable — too much context, a missing cache, a model that's over-specified for the task.